
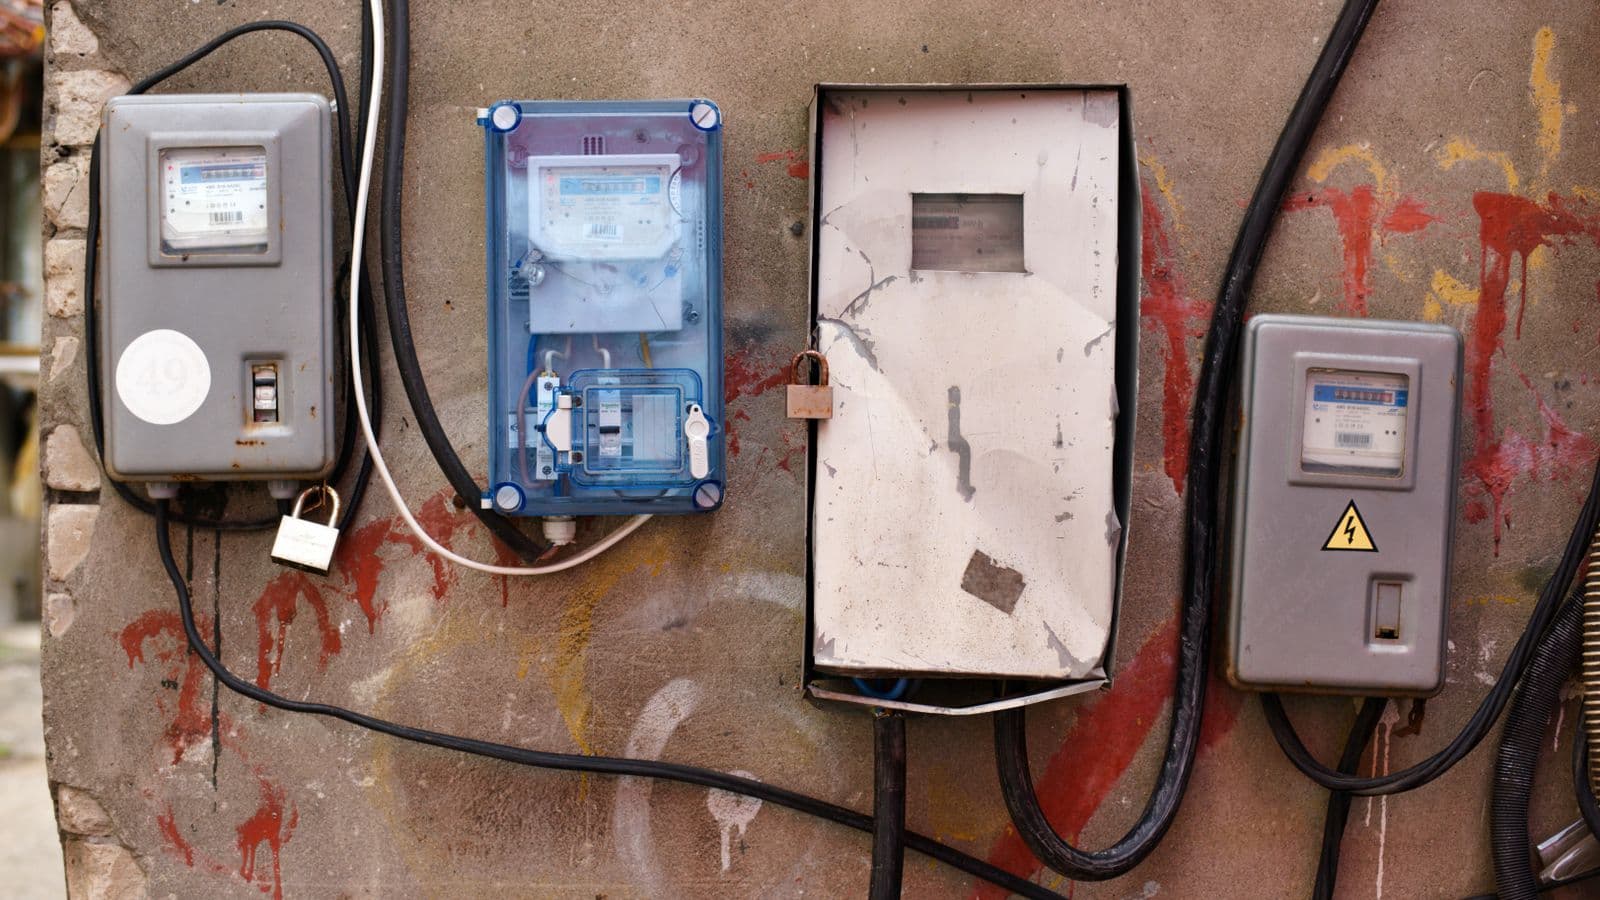
Most facilities see their electricity cost as a single number on a bill. But inside that number are losses you can't see, without knowing which line, which shift, which machine is consuming what, you can't know which loss to fix. Energy monitoring makes them visible, and what you can see, you can manage.
What is Energy Monitoring?
Energy monitoring is infrastructure that measures and logs which line, which machine, at which hour consumes how much energy. Measurement devices (energy analyzers, current transformers) placed at panel or machine level collect the data; it's reported via SCADA/HMI, giving both real-time and historical visibility.
Instead of a single monthly bill figure, you can now answer: how much does this line consume idle overnight? Which machine draws more current than expected? Which hour, and which equipment, drives the peak demand?
Which Losses Does it Reveal?
- Idle consumption: compressors, lighting and HVAC that keep running when there's no production, nights, weekends, breaks.
- Reactive load: inductive load that becomes a reactive penalty if uncorrected, see our reactive-penalty guide.
- Peak demand: sudden, simultaneous loads that raise the power component of your bill, several large motors starting at once, for example.
- Inefficient equipment: aging bearings, undersized motors or unmaintained lines drawing more than expected.
- Leakage/abnormal consumption: unexpected consumption at unexpected hours or on unexpected lines, often an early sign of a fault.
How the Monitoring Architecture is Built
- Identify measurement points: the main incomer, critical lines and high-consumption machines are prioritized, you don't need to meter every outlet, just the right points.
- Install energy analyzers and current transformers: integrated into panels without major changes to existing wiring.
- Communication layer: measurement devices connect over Modbus/RS-485 or Ethernet to a central PLC/SCADA system.
- Visualization and reporting: data is presented as real-time and historical charts on an HMI screen and/or a cloud dashboard, with alarms on threshold breaches.
- Analysis and action: the data is used to prioritize idle consumption, peak demand and inefficiency findings into an improvement plan.
How Does it Lower the Bill?
With monitoring data you base decisions on numbers, not guesses:
- Shut down idle consumption: identify equipment running outside shift hours and optimize the operating schedule.
- Fix reactive and harmonic issues: monitoring shows which line carries reactive-penalty risk; compensation removes that cost.
- Manage peak demand: see which equipment switches on simultaneously and stagger startup or scheduling to reduce the power charge.
- Prioritize inefficient equipment: identify the equipment losing the most, with data, and plan the investment accordingly.
- Catch anomalies early: an unexpected consumption spike is often the first sign of a fault, monitoring lets you catch it before the bill does.
Can it be Added to an Existing Plant?
Yes. You don't need to build an automation system from scratch, we add sensors, meters and PLC/SCADA integration to existing machines and panels to bring energy monitoring online in stages. The most efficient approach is usually to start with the highest-consumption lines and expand scope as the data proves its value, without a large upfront investment.
Monitoring Architecture by Facility Size
Energy monitoring isn't built to a single template, depending on the facility's size and criticality profile, one of two basic approaches (or a mix of both) is typically used:
- Single-point main-incomer metering: usually sufficient for small and mid-sized facilities. One energy analyzer is installed at the main panel incomer, making total consumption, power factor and peak demand visible. Installation cost is low and it's typically completed in a single day.
- Multi-point line-level metering: in large or multi-line facilities, each critical line or production area is metered separately. This gives a precise answer to "which line consumes how much" and makes it possible to isolate inefficient equipment at the line level, but it requires more measurement devices and communication infrastructure.
In practice, most facilities start with main-incomer metering and expand toward critical lines in stages, as the data proves its value. This keeps the upfront investment low while letting you see monitoring's impact on the bill early.
Which architecture is right depends heavily on whether the facility runs a single, homogeneous production line or several independent areas. In a single-line facility with uniform production, main-incomer metering usually delivers all the visibility you need. In facilities where different product groups run on different shifts, or where one energy-intensive area (a press line or a cooling system, for example) needs to be evaluated separately from the rest, adding a dedicated measurement point for that area pays for itself faster.
The cost difference between the two approaches is also worth being explicit about: single-point metering requires a low upfront investment and is usually commissioned in under a week. Multi-point metering carries a higher initial cost because it requires more measurement devices, cabling and engineering time, but in return it lets you see exactly how much each line or area contributes to the bill. During a site visit, we compare both options in concrete terms, approximate number of measurement points, installation time, expected level of visibility, and recommend an approach based on the facility's budget and priorities.
How Monitoring Data Justifies a Compensation Investment
Energy monitoring and compensation feed each other. Without monitoring data, the size of a compensation investment is usually a guess; with it, you can see concretely which line carries how much reactive load, how power factor moves through the day, and at which hours reactive-penalty risk concentrates. That lets the compensation system, capacitor power, number of stages, filter requirements, be sized correctly, so you neither overpay for an oversized system nor install an undersized one that fails to eliminate the penalty. Once compensation is commissioned, the same monitoring system continuously verifies the improvement in power factor and confirms the penalty risk has actually been removed, so you see the return on the investment in data, rather than assuming it.
This feedback loop is also what allows the compensation investment to be validated over its full operating life, not just at installation. Capacitor banks lose capacity over time, stage contactors can fail, and harmonic levels can shift as production conditions change; without continuous monitoring these degradations are typically only noticed on the next reactive-penalty invoice. With energy monitoring in place, even a small drift in power factor shows up as an early warning and can be turned into a planned maintenance call on the compensation system before it costs anything.
Concrete Findings Monitoring Typically Reveals in Bursa Industrial Facilities
In our field experience, a few types of findings turn up repeatedly once energy monitoring is installed at industrial facilities in Bursa:
- HVAC and compressors idling overnight: climate-control and compressed-air systems that keep running for hours after production stops are a loss that's invisible on the monthly bill but adds up to a significant line item over time.
- Weekend "phantom load": a baseline consumption that never drops to zero even when the facility is fully shut down, usually traced to forgotten standby equipment, permanently energized panels, or unnecessary lighting circuits.
- Peak-demand spikes from simultaneous motor starts: several large motors (compressors, pumps, cranes, etc.) starting at the same time or within a short window creates sharp, short-lived demand spikes that directly drive up the power component of the bill.
What these findings have in common is that none of them show up in a single monthly bill figure, they only surface through time-series data and line-level visibility. Facility managers are often surprised the first time they see these findings, because a consumption habit they assumed they already understood usually turns out to be substantially larger than expected. That's the real value of energy monitoring, not just collecting data, but testing facility management's intuitive assumptions against concrete numbers.
FAQ
Does installing energy monitoring stop production? No. Measurement devices are installed in panels with brief, planned outages rather than full shutdowns; in larger facilities this is typically completed within a single maintenance window.
How soon do savings show up? Findings like idle consumption and peak demand are usually visible from the first month; concrete savings show up on the bill within a few months, once improvement steps (schedule changes, compensation, etc.) are implemented.
Is energy monitoring the same as compensation? No, but they complement each other. Energy monitoring makes reactive load and other losses visible; compensation eliminates the reactive penalty. Installed together, you get both visibility and the fix.
Does it make sense for a small-scale facility too? Yes, scope is adjusted to the facility's size. Even a single main-incomer measurement is usually enough to reveal the biggest losses on the bill, like peak demand and idle consumption.
How long is measurement data retained, and can I compare against previous periods? Yes. The system is set up to store historical data, so you can compare consumption month over month or even season over season. Retention length is generally set based on the facility's needs and storage capacity; multi-year history is recommended for critical facilities.
Who can access the dashboard, and can multiple users have accounts? Yes. Multiple authorized users, facility manager, maintenance team, senior management, can access the dashboard with different permission levels. Access is typically web-based, and who can see which data is defined during setup.
If the facility already has a PLC/SCADA system, does energy monitoring integrate with it? Yes, in most cases. It's integrated into the existing PLC/SCADA infrastructure over Modbus or similar communication protocols, building on the existing investment rather than standing up a separate system from scratch. The scope of integration is assessed based on the age of the existing system and its support for open communication.
Does the energy monitoring system need extra maintenance once it's installed? Minimal. The calibration of measurement devices is checked periodically and the communication infrastructure is verified to be working correctly; this is typically handled as part of YGİS or general maintenance visits without generating a separate cost.
Can alarms and threshold values be changed later? Yes. Threshold values, for example, an alert when a line exceeds a certain current level, can be readjusted as the facility's needs change. Reviewing these thresholds whenever new equipment is commissioned or the production schedule changes keeps the alarms meaningful.
Let's talk through this together
The SOREAS engineering team can assess what's covered here for your specific facility. Reach out via the contact form or call us directly.