
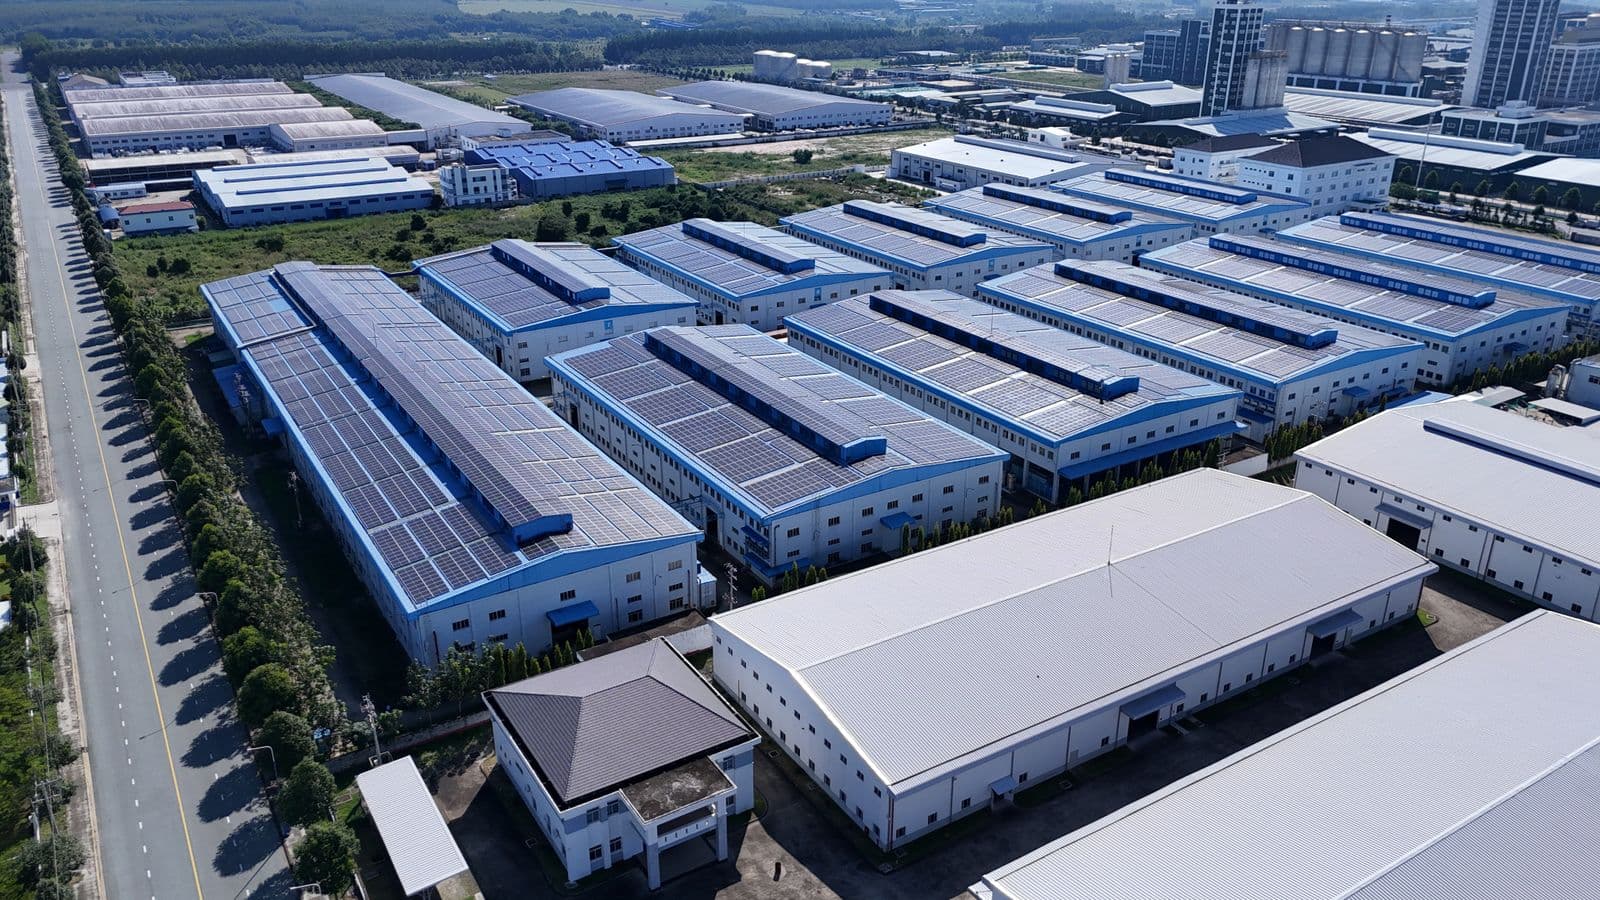
At most production facilities across Bursa's 17 organized industrial zones, the electricity bill is treated as a fixed cost of doing business, yet a meaningful portion of that bill is made up of losses that the right engineering intervention can eliminate. The problem is not knowing where those losses sit: which motor was oversized at selection, which feeder is suffering excessive voltage drop, which compressor draws near-full power even while idling? An energy efficiency survey is a systematic engineering exercise that answers these questions with measurement rather than guesswork. A well-run survey doesn't hand the facility a generic recommendation to "save energy", it delivers a concrete roadmap showing which investment pays back, and how fast.
What Is an Energy Efficiency Survey, and What Does It Aim to Do?
An energy efficiency survey is an end-to-end engineering analysis of a facility's energy consumption structure, identifying the source of losses, the efficiency level of equipment, and the potential for improvement. The goal isn't to produce a single number ("15% savings possible"), it's to show exactly which measures deliver that savings, at what investment cost, and over what timeframe. A survey answers three core questions: Where is the energy going? How much of that consumption is genuinely necessary, and how much is loss? And what measure reduces the loss, at what cost, with what return?
Load Profiling: The Facility's Energy Fingerprint
The survey's first and most data-intensive phase is establishing the facility's load profile. This is done by connecting energy analyzers to the main incoming feed and to critical sub-circuits (compressor line, lighting, HVAC, production lines), typically collecting continuous data over a period of one week to one month. The collected data reveals:
- Time-based consumption curve: how consumption behaves across shift changes, breaks, and weekends, the "base load" consumed by idling equipment becomes clearly visible here.
- Demand peaks: sudden load spikes that can trigger penalties or added cost depending on the tariff structure.
- Power factor and reactive energy behavior: the adequacy of the compensation system and the risk of a reactive power penalty.
- Harmonic distortion levels: the distortion that variable speed drives and electronic loads introduce into the grid, both an additional loss and a factor that shortens equipment life.
This data-collection process largely overlaps with what a continuous energy monitoring system provides; at facilities that already have monitoring infrastructure in place, this phase of the survey moves considerably faster.
Identifying Sources of Loss
Once the load profile is established, the survey separates the portion of consumption that goes toward necessary work from the portion that is pure loss. Typical loss sources in industrial facilities include:
- Cable and conductor losses: voltage drop and I²R loss on undersized or excessively long feeders; cable selections that don't follow TS HD 60364-5-52 amplify this loss.
- Transformer core and copper losses: aging or overloaded transformers can show no-load losses (core loss) and load losses (copper loss) well above expected levels.
- Reactive power losses: a low power factor forces the grid to supply more apparent power for the same work, adding loss along the distribution line.
- Inefficient motor and drive usage: older, standard-efficiency (IE1/IE2) motors consume noticeably more energy than higher-efficiency (IE3/IE4) equivalents for the same output.
- Oversized equipment: a compressor, pump, or fan selected larger than the facility actually needs runs at an inefficient partial-load point, wasting energy.
- Lighting losses: lighting systems running at higher wattage or for longer than necessary are a significant savings item, especially in areas that don't operate 24/7.
- Compressed air leaks: leaks in compressor lines can cause a large share of the compressed air produced to be lost without doing any useful work.
Equipment Efficiency Assessment
Alongside load profiling and loss analysis, the survey evaluates the efficiency class of critical facility equipment:
- Motor inventory and efficiency classification: the power, operating hours, and efficiency class (IE code) of every significant motor is recorded; low-efficiency motors with high operating hours are flagged as replacement priorities.
- Transformer loading ratio and efficiency: based on the efficiency classes under IEC 60076-1:2011, the calculation shows how efficiently the transformer runs at its current loading ratio, both excessively low and excessively high loading reduce efficiency.
- HVAC and process heating system condition: in industrial facilities, climate control and process heating can account for a significant share of overall consumption.
- Compensation system adequacy: whether the existing capacitor bank matches the facility's actual reactive load profile, assessed against IEC 60831 and, in harmonic-rich environments, IEC 61642.
Turning Findings into a Prioritized Investment List
A survey's real value shows up when it converts identified losses into an actionable plan. This conversion is structured as follows:
- Calculating savings potential for each finding: based on measured data, the calculation shows how many kWh and how much currency the proposed measure would save annually.
- Estimating implementation cost: the investment required for the measure (equipment, labor, commissioning) is estimated.
- Calculating payback period: dividing investment cost by annual savings shows how many months or years each measure takes to pay for itself.
- Prioritization: measures are presented in two categories, short-payback "quick wins" (compensation improvement, lighting retrofit) and longer-term, larger-investment measures (transformer replacement, a motor replacement program).
- Cumulative impact table: showing the total savings rate and overall payback period if all measures are implemented together.
This approach lets facility management direct a limited investment budget toward the measures with the highest return, a data-driven ranking rather than an attempt to "do everything at once."
The Link to Energy Monitoring and Compensation
An energy efficiency survey should be treated as the starting point of an ongoing process, not a one-time snapshot. When the temporary measurement infrastructure set up during the survey is converted into a permanent energy monitoring system, the actual impact of implemented measures can be verified over time, and newly emerging deviations are caught early. Similarly, the low power factor or reactive-penalty risk identified during the survey directly informs the resizing of the compensation system, a topic covered in more detail in our guide on preventing reactive power penalties.
Typical Opportunity Areas in Industrial Facilities
Recurring opportunity areas found in surveys across Bursa's production facilities include:
- Compressed air systems: high leak rates and compressors running inefficiently at partial load, usually one of the fastest-payback areas.
- Lighting conversion: switching from conventional fixtures to LED, done while maintaining illumination levels per TS EN 12464-1:2021, both reduces consumption and improves visual comfort.
- Motor and drive retrofits: adding a variable speed drive (VSD) to motors that run continuously with a variable load profile delivers significant savings in systems operating at partial load.
- Substation optimization: resizing transformers that run either significantly overloaded or significantly underloaded.
- Heat recovery: reusing compressor or process waste heat for in-facility heating purposes.
- Reactive power compensation: improving power factor both prevents reactive penalties and reduces losses along the distribution line.
Why a Survey Is Not the Same as a Bill Review
Many businesses conflate an "energy efficiency survey" with a "bill review." A bill review compares total consumption and cost across past periods, but it doesn't show how that consumption is distributed within the facility, which equipment accounts for what share, or which portion is pure loss. A high reactive-energy charge on the monthly bill, for instance, may point to an inadequate compensation system, but the bill itself won't say which equipment is driving that inadequacy. Decisions made without field measurement are often misprioritized: a facility might invest in lighting, a visibly large cost item, while leaks in a compressor line producing far greater losses go unnoticed. A serious survey therefore treats billing data only as a starting point and completes the actual diagnosis through field measurement.
Stages of the Survey Process
A typical energy efficiency survey follows these stages:
- Preliminary assessment: reviewing the facility's billing history, single-line diagram, and equipment inventory.
- Field measurement: connecting energy analyzers at critical points and beginning data collection.
- Data analysis: processing collected data into a load profile and loss analysis.
- Equipment assessment: evaluating the efficiency status of motors, transformers, compensation, and lighting systems.
- Reporting: compiling findings into a prioritized report with savings potential and payback period for each measure.
- Presentation and roadmap: presenting findings to facility management and agreeing on an implementation timeline.
Common Mistakes
- Limiting the survey to a bill review: the total consumption figure on an invoice doesn't show where losses actually occur; a "survey" done without field measurement stays superficial.
- Generalizing from a short measurement window: a single day or a few hours of measurement doesn't reflect the facility's actual consumption behavior across different shifts and seasonal conditions.
- Ranking measures without factoring in payback period: a measure that looks like a large savings percentage can be misleading in priority order if its payback period is long.
- Treating the survey as a one-time project: if the impact of implemented measures isn't tracked, new inefficiencies accumulate unnoticed over time.
- Ignoring compensation and harmonic interaction: a capacitor bank sized without considering the facility's harmonic sources can create a resonance risk.
- Selecting replacement equipment by catalog rating rather than load profile: a motor's or transformer's nameplate power doesn't guarantee its efficiency under actual operating conditions.
FAQ
How long does an energy efficiency survey take? Depending on facility size and measurement scope, field measurement typically takes one to four weeks; data analysis and reporting can add a few more weeks after that.
Does production stop during the survey? No. Measurement equipment is installed while the facility operates normally, and data is collected without affecting production flow.
Do all the recommended investments need to be implemented at once? No. The report prioritizes measures by payback period, so facility management can start with short-term measures and move to larger investments in stages, according to budget.
What's the difference between an energy efficiency survey and an energy monitoring system? A survey is a diagnostic exercise conducted over a defined period; energy monitoring is a continuous, permanent tracking system. A survey often sets the groundwork for installing a monitoring system, or for deeper analysis of an existing one's data.
Does it make sense for a smaller facility to commission a survey? Yes. Regardless of facility size, if electricity cost makes up a significant share of operating expenses, a targeted survey can uncover opportunities that pay for themselves quickly.
What information does the survey report include? Load profile charts, identified loss sources, equipment efficiency assessment, recommended measures, estimated investment and payback period for each measure, and an overall prioritized action plan.
How do survey results connect to compensation system installation? The power factor and harmonic data measured during the survey feed directly into correctly sizing the compensation system, preventing both reactive penalty risk and unnecessarily oversized capacitor investment.
How often should a survey be repeated? A follow-up survey is useful after major measures are implemented, to verify impact; more broadly, updating the survey is recommended whenever production capacity or the equipment base changes significantly.
Conclusion
An energy efficiency survey turns "where are the savings" from a guess into a measured engineering exercise, and turns its findings into a concrete investment plan. Done properly, it gives facility management both short-term quick wins and long-term strategic investments in a single framework, and forms the foundation for both energy monitoring and compensation work.
Let's talk through this together
The SOREAS engineering team can assess what's covered here for your specific facility. Reach out via the contact form or call us directly.